
EA Modelling Steps for Business Capability Map:
- Anand Nerurkar
- Aug 13, 2023
- 4 min read

Industry Supported Tools
· Sparx Enterprise Architect – (Tech Users)
o Comprehensive modelling environment to let users collaborate
o Create Architecture models in central enterprise repository
o Metamodel across EA domains
· Sparx Prolaborate (Business/Executive)
o Web based sharing and collaboration platform to curate models
o It makes use of EA repository and metamodel
o Integrate it with MS office
o Upload existing capability excel sheet and convert it to EA model
o To let curated models & dashboards to be shared with business/executive
o Due Diligence & insights with various dashboard in the form of
o Bubble chart
o Pie chart
o Roadmap
o Heatmap
o Landing Charts

· ABACUS
· BIZ Design
· Orbus
Setting Up EA Repository


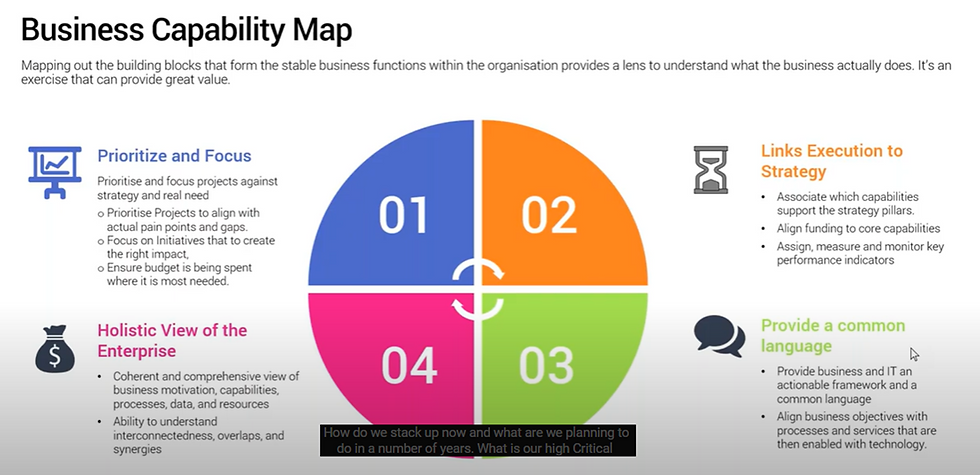
Business Capability Map
One of the very important activity in the EA modelling for any business strategy, initiative to be completed
· High value and benefit activity in EA model
· Capture capability of our business- what we do today and what we will do in the future to support strategy
· High critical capability, supporting capability
· Setting target, KPI, metrices to measure
· Mapping it with technical capability for the implementation
· Align strategy with projects, business initiative, implementation & execution with downstream team
· Mapping it with Value stream to deliver capability
· Support standard based implementation
o TOGAF
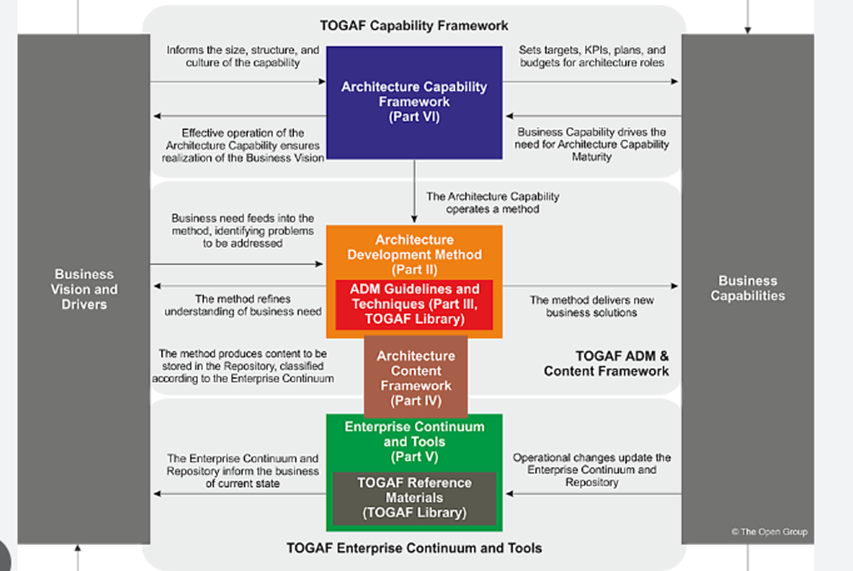
o BizBOK
o ArchiMate

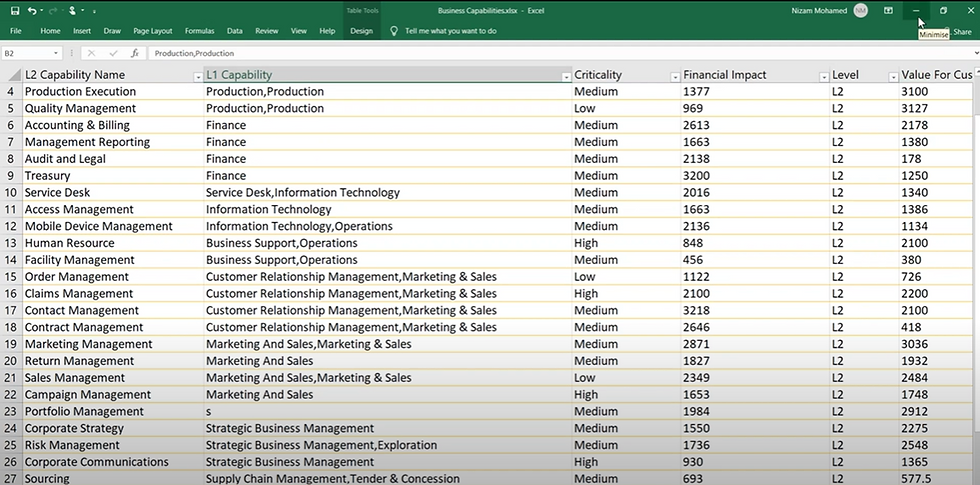
Each business capability will be having certain attributes like
Criticality high/medium/low
Environment dev/test/prod
Financial impact critical/high/medium/low
Cost $50 millions
Category – L0/L1/L2
We can analysis further on this and present data to business by applying bubble chart or heatmap and drive the decision further regarding investment, improvement, retire, rearchitect etc
We can also import existing capability data in the form excel sheet to EA and then use this data as basis for further capability analysis.
Normally each capability may have 3-6 levels ,level 0/1 is mostly for senior leadership to understand high level for the business capabilities, provide funding for new capability, which initiative to take further. These will be further decomposed into sub-capability further.
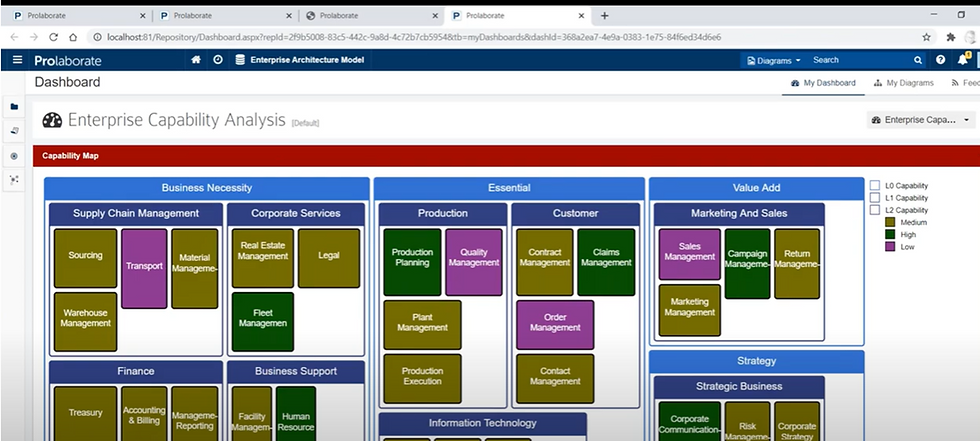
For example: Business Capability Map

Heat Mapping
==
· Help identify opportunities for business improvement or investment.
· It visually highlights business capabilities that are performing at a sub-optimal level, or that might not exist in a form that is required to meet some future strategic need.
· show a range of different perspectives in terms of
o Maturity
o Effectiveness
o Performance
o Value contribution of each capability to the business
o Cost contribution of each capability to the business

Heat Mapping- Capability Perspective
Yellow – some issues, but low priority
Red – need immediate attention
Green – stable
Purple- new business capability business need to develop
Agent Management (purple) is a new business capability that the business wishes to develop. Business leaders can then take this information and ensure that investments and project initiatives are prioritized and funded at an appropriate level to bring those business capabilities shown in purple, red, or yellow up to the desired level of maturity.
Depending on criteria, we can have different heat mapping perspective as below
· Strategic contribution
· Revenue contribution
· Cost contribution
· Performance
· Criticality
· Effectiveness
Modelling ( Harvesting Business capabilities)
We can create it from the scratch or we can import it from our existing capability excel sheet data
Let us import existing capability data in excel to EA tool as below
This is Excel sheet that we need to import
In EA tool, locate EA model-business capability-open existing capability as below

Strategy- L0 capability- linked to -> Strategy business management-L1 capability
This does not have any L2 capability. We will import existing L2 capability data here
Select capabilty


Click preview & import into EAS model

Since we have l1 capability connection, we need to import that into our existing l1 capability to connect
Click advanced setting -select l1 capability as below

Click yes

It import data and connect to l1 capability

Now we can see Marketing capability has l2 capability as below, it mean data is imported successfully.
To see it, right click on marketing-insert related elements


Just enable heat map as below

Check apply auto color -click ok – will generate heat map based on critical statusto find out which capability are high/medium/low


Metamodel at strategy/motivational layer

Metmodel at business layer


Once we have business capability map and corresponding EA model , we need to perform due diligence , that is where we make use of landscape charts with heat map applied to find out l2 capability with required capability.
Due Diligence & Insights using capabilities

Value stream-capability-applications- cross architectural layer view

Let us say we need to further analyze business capability w.r.t. certain parameter say value or cost or value perceived by the customer. Financial impact,
We could use bubble chart and drive these with attribute to find out which capability are value driver etc. How does capability stack up in terms of value, financial impacts.

Prolaborate is web based -sharing and collaboration platform that integrate with your EA modelling tool and present those valuable insights to business users in the form
Of dashboards as below
· Bubble chart
· Pie chart
· Heat map
· Roadmap
· Landscape chart
· Value stream-capability-application view
Create dashboards


Click add widget-add new
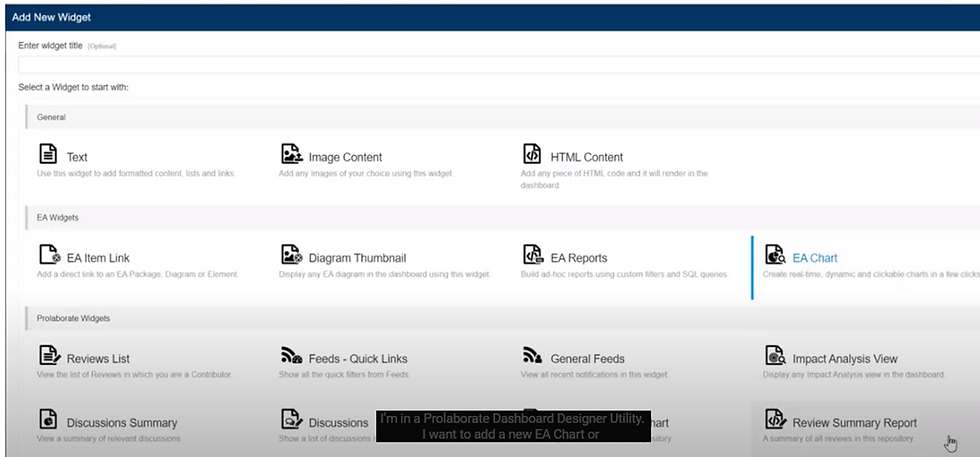
This will be based on EA models , so it is integrated with EA

Select EA charts

Once Designer is selected,below screen comes-choose packages


Once L0 capability selected, designer will populate if any capability exist for it, select it- L0 capability
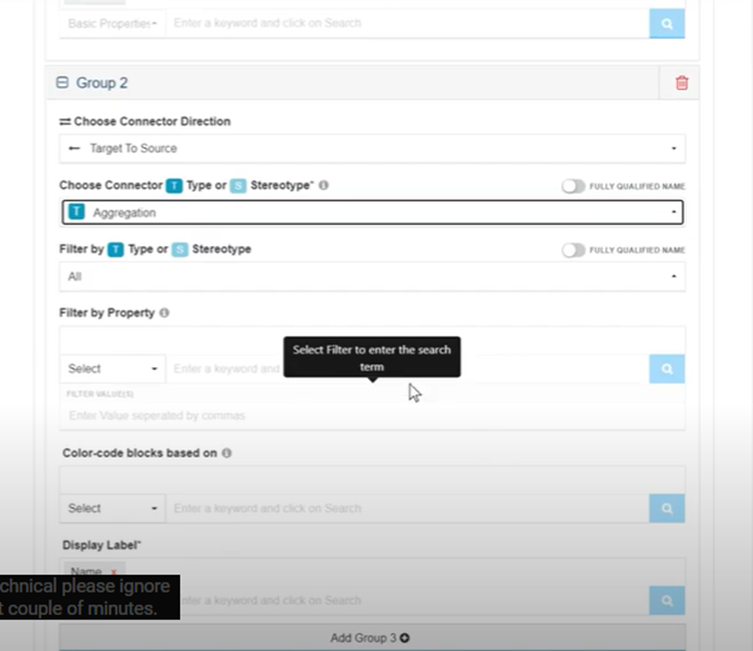
Then we need to see connection to L1 capability -from L0 capability – click Add Group2

Choose connector direction as target pt source -from L0->L1
Connector as aggragator
Click on add group3 – for L3 capability
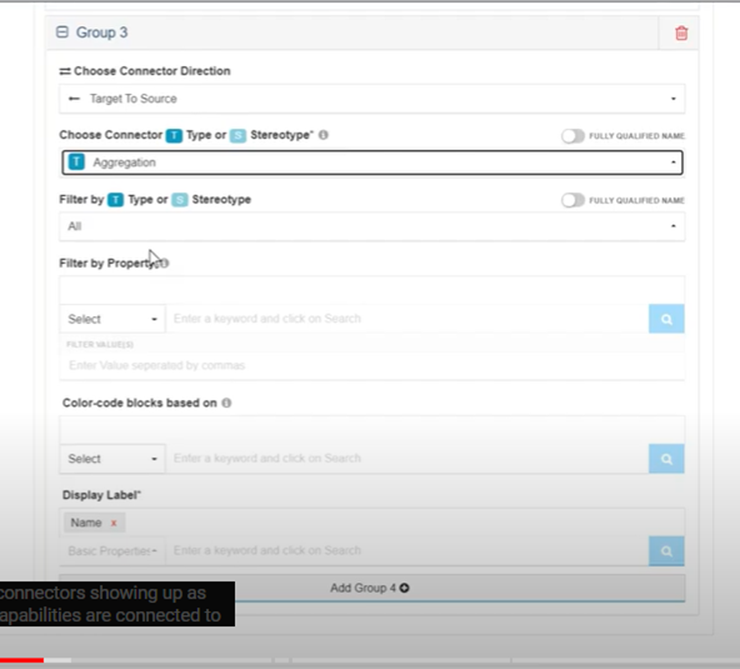

Heat map – color coded value

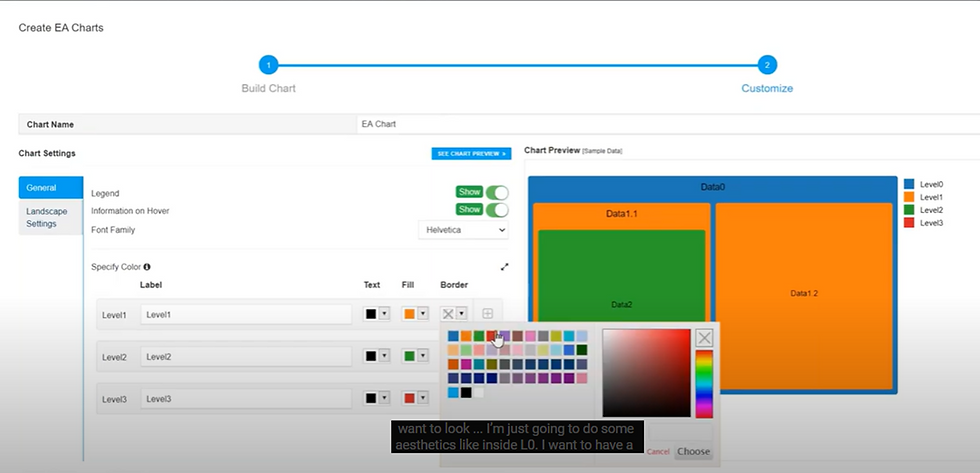
Color block for heatmap

Save Dashboard-refresh it, will see below view

Bubble chart
--

Bubble chart for L1 capability as below
X axis – tagged value- value to customer
Y axis-tagged value – financial impact
Size of bubble -tagged value


Save dashboard and see below bubble chart

Advanced Analysis tools


Click on business capabilities to Applications

Relationship view

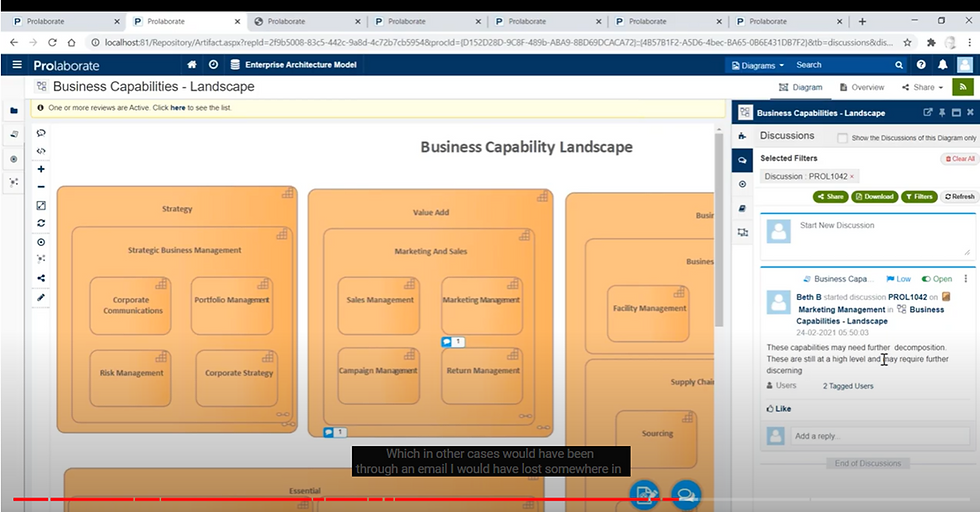
Architectural Reviews


To do this , we enable feedback & collaboration layer on top of EA Models, follow the review and feedback mechanism.
Based on the user entitlement, user could see repective curated views
For Ex : Andy is part EA Team , he could see how capability is linked to enterprise strategy,goals, roadmap etc.
Sandy could only review particular business cability and be the review for it.

Conclusion
So By using EA models and Prolaborate tools , we can perform due diligence and insights.


Comments